Author: Manuel Lemos
Viewers: 1,572
Last month viewers: 30
Categories: PHP Tutorials
Therefore all developers need to use debugging tools to fix their code as soon as possible.
XDebug is an excellent debugging extension but it can be used in aw way that is more productive if you use it in conjunction with a IDE like CodeLobster that provides support to debug PHP code using XDebug.
Read this article to learn how to debug PHP code using CodeLobster IDE with XDebug.
Setup XDebug in CodeLobster IDE
Before starting a new PHP project, we should think about working on errors before these errors occur.
There is a special extension in PHP - XDebug, which provides the ability to work from the IDE environment, to output a stack trace, receive profiler data, use breakpoints, and debug step by step.
In this article we will explain how CodeLobster IDE works in conjunction with XDebug, and also consider how to set up this extension on the local XAMPP server.
Certainly, CodeLobster will take care about following the rules of the syntax of the programing language, thanks to code highlighting, prompts on functions and autocompletion.
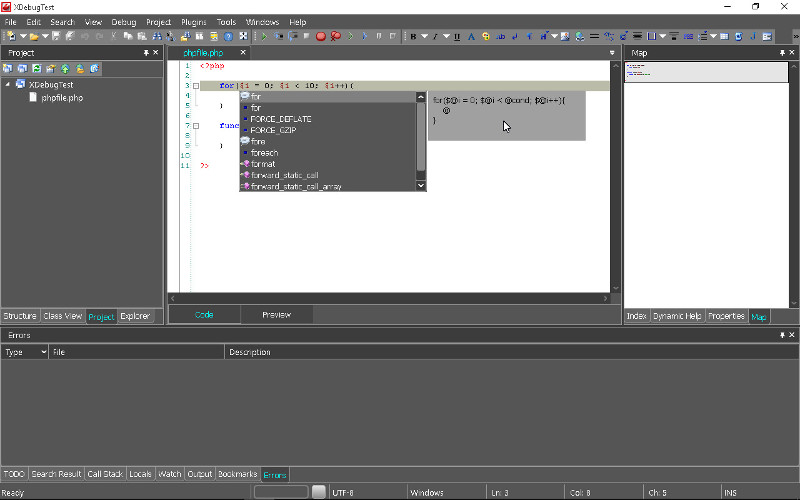
At the same time, programmers are not insured against logical errors in their scripts.
For example, in PHP such a construction is possible:
<?php zzz
 $a = array('a' => 'first', 'b' => 2, 'c' => true);
Or something like this:
<?php
$n = 5;
//And somewhere through 100 lines of code�
$n = 'User Name';
Of course, in Java or in C++, such a trick with arrays or variables will not work, since these are strongly typed programming languages.
Moreover, the very purpose of PHP as a language for building dynamic applications that interact with users, obliges the programmer to monitor and check sometimes unpredictable user input.
Web developers, accustomed to the flexibility and broad capabilities of PHP, must pay for the speed of design, paying close attention while develop their applications.
Turning on display of errors and warnings in PHP
Open in a text editor php.ini file, which in our case is located in the folder "D:\xampp-portable\php" and set the following parameters:
display_errors = On
error_reporting = E_ALL
You can configure programmatically by inserting the following code at the beginning of the script:
<?php
 ini_set('display_errors', 'On');
 error_reporting(E_ALL);
E_ALL is not required to be enclosed in quotation marks, since it is a constant, that enables the display of all error messages, as well as all warnings.
Enable the XDebug extension and configure the IDE
In order to activate XDebug, open the php.ini file and find the appropriate section [XDebug]. We activate the extension by setting such options:
zend_extension = "\xampp-portable\php\ext\php_xdebug.dll"
So we pointed out to the PHP engine the location of the extension.
xdebug.remote_enable = 1
Actually, this option enables debugging, allowing the debugger to connect to the IDE and send data.
xdebug.remote_host = "127.0.0.1"
xdebug.remote_port = "9000"
We have set the host and port - this is the machine address on which the client will work, in this case it is our IDE.
Start XAMPP and open the CodeLobster, go to the main menu of the program -> "Tools" -> "Preferences", in the opened dialog select "Debugger".
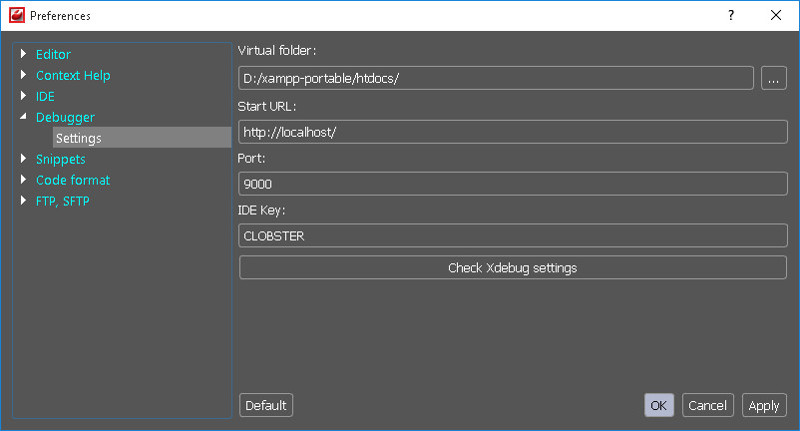
As the "Virtual folder" parameter, we will select the root directory of XAMPP "htdocs" - this is the folder where the virtual sites and our test project will be located.
In the "Start URL" field, specify the base address "http://localhost/" - this is the URL of the root directory of the virtual server.
The value of the "Port" option is left by default, since this is the value used by the debugger in most cases.
Click "OK" and you can proceed to review the test application. The project we have created contains one PHP file with the following content:
<?php
 for($i = 0; $i < 10; $i++) {
 echo power2($i);
 }

 function power2($base) {
 return pow($base, 2) . "<br />";
 }
?>
Here we call the function power2() in the loop and pass to it the current value of the counter $i, sequentially, from 0 to 9. This method raises the passed value to power 2 and returns each result in a separate line.
Let's open the source project file in the editor and set the breakpoint at the beginning of the file or in the place from which you want to start debugging the script.
Then press F5, the application will be opened in the browser by default and the script execution will stop at the first breakpoint.
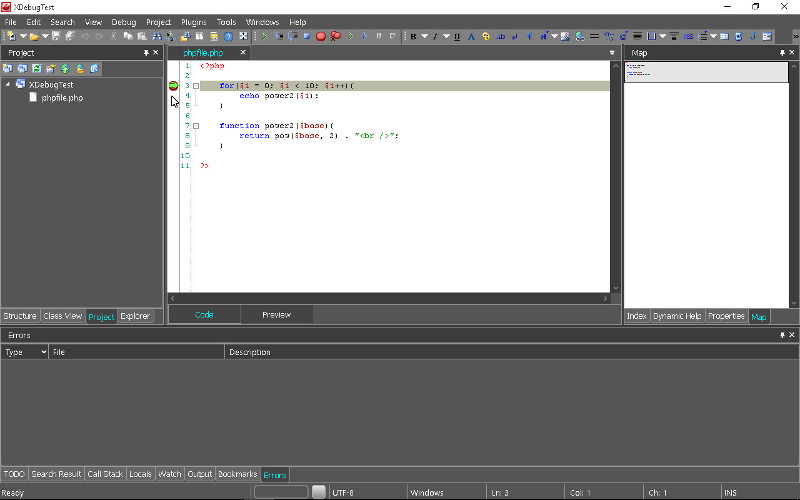
Now you can go through each line of code sequentially by pressing the F11 key, or from one breakpoint to another, by repeatedly pressing F5.
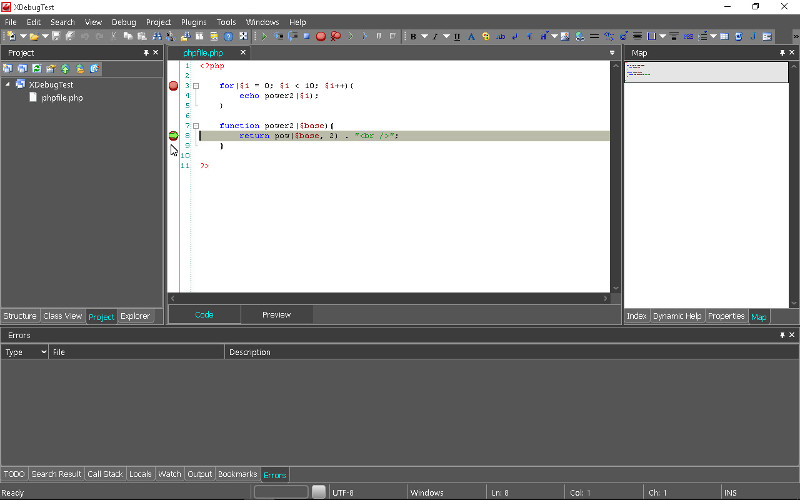
The stop points are added and deleted by mouse click to the left of the line number in the editor, or by pressing the F9 key.
Generate the CSS style for border radius, fonts, transforms, backgrounds, box and text shadows with the online CSS code generators.
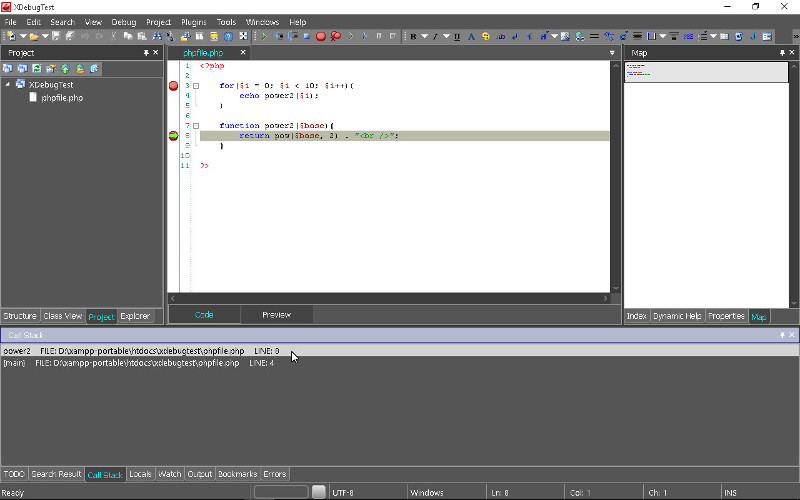
And at every moment when the cursor stops we have the opportunity to get full information about the current state of the application, looking to the tabs on the bottom panel of the IDE.
The "Call Stack" tab allows you to trace the entire sequence of function calls up to the current moment, namely, the path that the interpreter passed through our code.
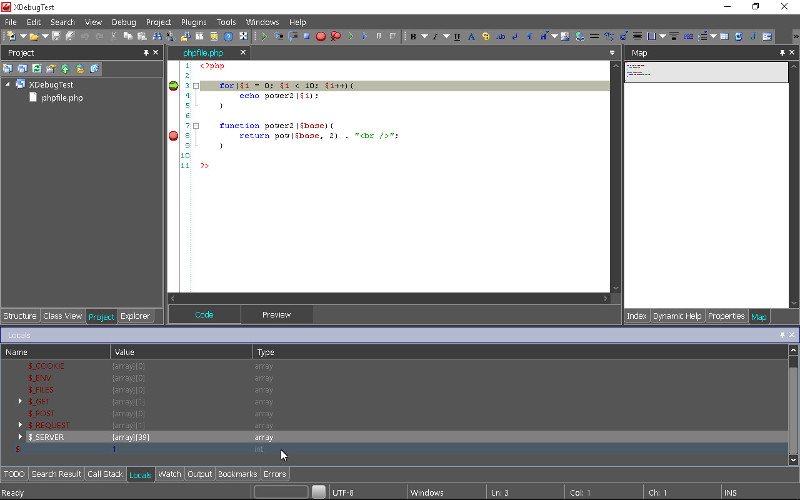
The "Locals" tab reflects the current state of variables in the context of our application. In this example, at any step during debugging you can find out the value of the $i counter, as well as the contents of global and super global variables, such as $_GET, $_POST, $_SERVER, and others.
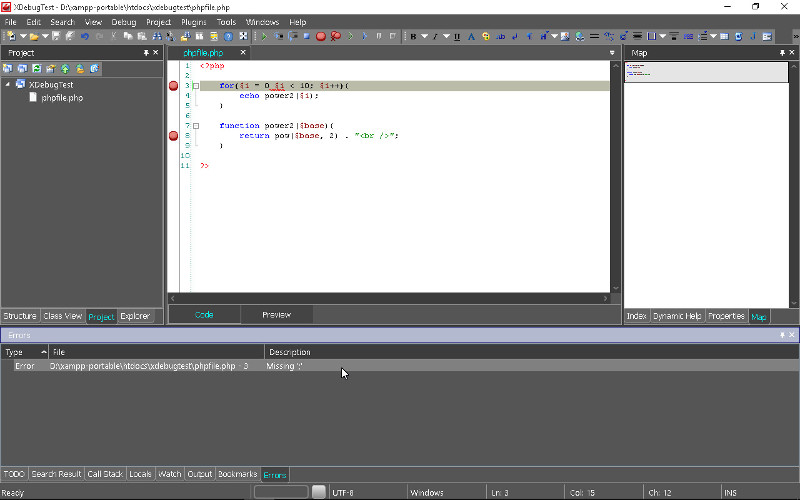
The "Errors" tab shows the list of errors that occurred, it tells us the type of error, file name and line number, as well as a brief description of the situation, that allows the programmer to quickly orient and fix the bug.
Also useful is the ability to add variables to the watch list, the so-called Watch. Use the context menu for this, right click on the variable and select "Add Watch" or press Alt + Shift + W hotkeys.
Thus, by opening the "Watch" tab, you will be able to observe the changes in the values of several variables at the same time as you go with the debugger through your code.
You can stop the debugging process at any time by pressing Shift + F5.
So, let's sum up
CodeLobster IDE easily integrates with XDebug, the program practically does not require any settings for that and the debugging process is organized predictably and understandably even for a beginner developer.
Setting up XDebug to interact with the IDE, as you could already sure, also does not cause any difficulties.
Now you know the efficient way to speed up the process of finding and fixing errors in your applications and you can avoid cumbersome constructions in your code, like the var_dump() or print_r() functions.
You can use CodeLobster IDE for free downloading any of the available versions for Windows Mac OS and Linux from here CodeLobster IDE.
You need to be a registered user or login to post a comment
Login Immediately with your account on:
Comments:
No comments were submitted yet.


